
Page 28 - Regional_rice_report_with_full_bookmarks
P. 28
PROJECT “NETWORK FOR AGRICULTURE AND RURAL DEVELOPMENT
THINK-TAKS FOR COUNTRIES IN MEKONG-SUB REGION” (NARDT)
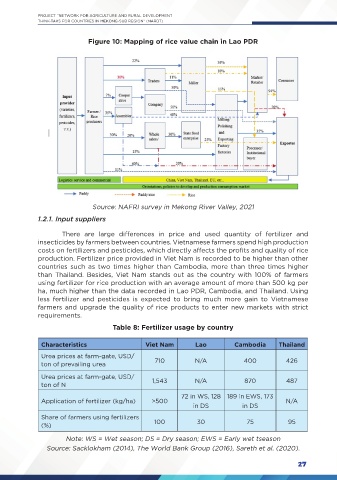
Figure 10: Mapping of rice value chain in Lao PDR
Source: NAFRI survey in Mekong River Valley, 2021
1.2.1. Input suppliers
There are large differences in price and used quantity of fertilizer and
insecticides by farmers between countries. Vietnamese farmers spend high production
costs on fertilizers and pesticides, which directly affects the profits and quality of rice
production. Fertilizer price provided in Viet Nam is recorded to be higher than other
countries such as two times higher than Cambodia, more than three times higher
than Thailand. Besides, Viet Nam stands out as the country with 100% of farmers
using fertilizer for rice production with an average amount of more than 500 kg per
ha, much higher than the data recorded in Lao PDR, Cambodia, and Thailand. Using
less fertilizer and pesticides is expected to bring much more gain to Vietnamese
farmers and upgrade the quality of rice products to enter new markets with strict
requirements.
Table 8: Fertilizer usage by country
Characteristics Viet Nam Lao Cambodia Thailand
Urea prices at farm-gate, USD/ 710 N/A 400 426
ton of prevailing urea
Urea prices at farm-gate, USD/ 1,543 N/A 870 487
ton of N
72 in WS, 128 189 in EWS, 173
Application of fertilizer (kg/ha) >500 N/A
in DS in DS
Share of farmers using fertilizers
(%) 100 30 75 95
Note: WS = Wet season; DS = Dry season; EWS = Early wet tseason
Source: Sacklokham (2014), The World Bank Group (2016), Sareth et al. (2020).
27