
Page 42 - Regional_rice_report_with_full_bookmarks
P. 42
PROJECT “NETWORK FOR AGRICULTURE AND RURAL DEVELOPMENT
THINK-TAKS FOR COUNTRIES IN MEKONG-SUB REGION” (NARDT)
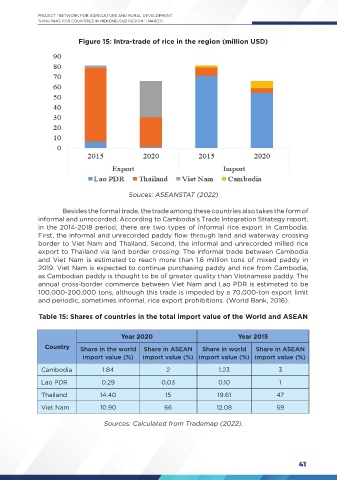
Figure 15: Intra-trade of rice in the region (million USD)
Souces: ASEANSTAT (2022)
Besides the formal trade, the trade among these countries also takes the form of
informal and unrecorded. According to Cambodia’s Trade Integration Strategy report,
in the 2014-2018 period, there are two types of informal rice export in Cambodia.
First, the informal and unrecorded paddy flow through land and waterway crossing
border to Viet Nam and Thailand. Second, the informal and unrecorded milled rice
export to Thailand via land border crossing. The informal trade between Cambodia
and Viet Nam is estimated to reach more than 1.6 million tons of mixed paddy in
2019. Viet Nam is expected to continue purchasing paddy and rice from Cambodia,
as Cambodian paddy is thought to be of greater quality than Vietnamese paddy. The
annual cross-border commerce between Viet Nam and Lao PDR is estimated to be
100,000-200,000 tons, although this trade is impeded by a 70,000-ton export limit
and periodic, sometimes informal, rice export prohibitions. (World Bank, 2016).
Table 15: Shares of countries in the total import value of the World and ASEAN
Year 2020 Year 2015
Country Share in the world Share in ASEAN Share in world Share in ASEAN
import value (%) import value (%) import value (%) import value (%)
Cambodia 1.84 2 1.23 3
Lao PDR 0.29 0.03 0.10 1
Thailand 14.40 15 19.61 47
Viet Nam 10.90 66 12.08 59
Sources: Calculated from Trademap (2022).
41