
Page 38 - Regional_rice_report_with_full_bookmarks
P. 38
PROJECT “NETWORK FOR AGRICULTURE AND RURAL DEVELOPMENT
THINK-TAKS FOR COUNTRIES IN MEKONG-SUB REGION” (NARDT)
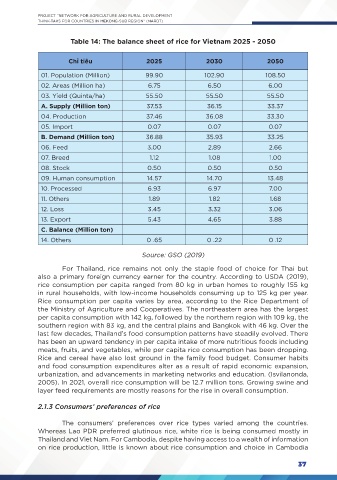
Table 14: The balance sheet of rice for Vietnam 2025 - 2050
Chỉ tiêu 2025 2030 2050
01. Population (Million) 99.90 102.90 108.50
02. Areas (Million ha) 6.75 6.50 6.00
03. Yield (Quinta/ha) 55.50 55.50 55.50
A. Supply (Million ton) 37.53 36.15 33.37
04. Production 37.46 36.08 33.30
05. Import 0.07 0.07 0.07
B. Demand (Million ton) 36.88 35.93 33.25
06. Feed 3.00 2.89 2.66
07. Breed 1.12 1.08 1.00
08. Stock 0.50 0.50 0.50
09. Human consumption 14.57 14.70 13.48
10. Processed 6.93 6.97 7.00
11. Others 1.89 1.82 1.68
12. Loss 3.45 3.32 3.06
13. Export 5.43 4.65 3.88
C. Balance (Million ton)
14. Others 0 .65 0 .22 0 .12
Source: GSO (2019)
For Thailand, rice remains not only the staple food of choice for Thai but
also a primary foreign currency earner for the country. According to USDA (2019),
rice consumption per capita ranged from 80 kg in urban homes to roughly 155 kg
in rural households, with low-income households consuming up to 125 kg per year.
Rice consumption per capita varies by area, according to the Rice Department of
the Ministry of Agriculture and Cooperatives. The northeastern area has the largest
per capita consumption with 142 kg, followed by the northern region with 109 kg, the
southern region with 83 kg, and the central plains and Bangkok with 46 kg. Over the
last few decades, Thailand’s food consumption patterns have steadily evolved. There
has been an upward tendency in per capita intake of more nutritious foods including
meats, fruits, and vegetables, while per capita rice consumption has been dropping.
Rice and cereal have also lost ground in the family food budget. Consumer habits
and food consumption expenditures alter as a result of rapid economic expansion,
urbanization, and advancements in marketing networks and education. (Isvilanonda,
2005). In 2021, overall rice consumption will be 12.7 million tons. Growing swine and
layer feed requirements are mostly reasons for the rise in overall consumption.
2.1.3 Consumers’ preferences of rice
The consumers’ preferences over rice types varied among the countries.
Whereas Lao PDR preferred glutinous rice, white rice is being consumed mostly in
Thailand and Viet Nam. For Cambodia, despite having access to a wealth of information
on rice production, little is known about rice consumption and choice in Cambodia
37